Introduction
Puerto Rico had a swarm (or sequence) of earthquakes at the end of 2019 and the start of 2020. So far, the largest was a magnitude 6.4 on January 7, 2020.
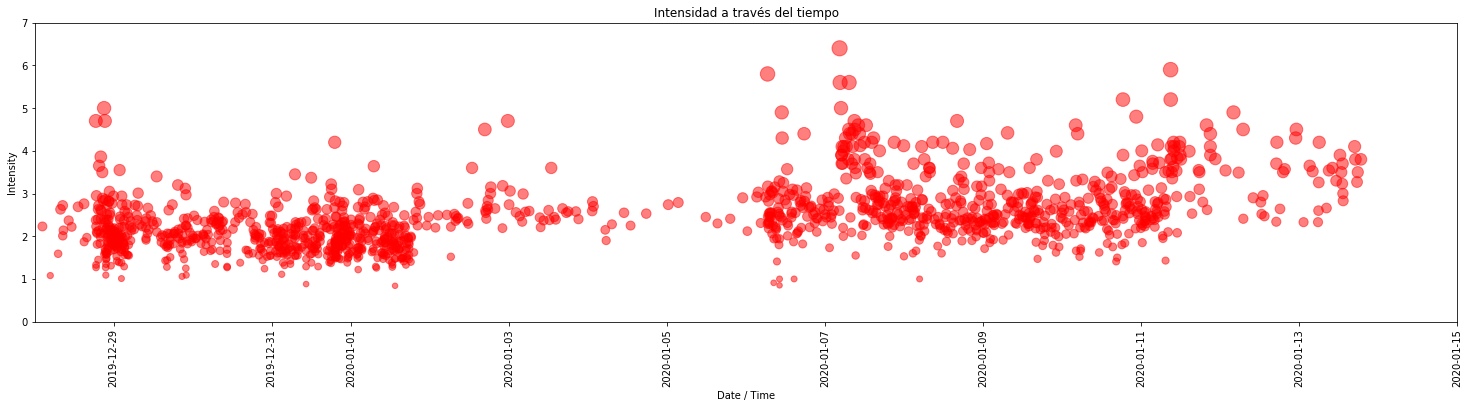
Since around December 28, there have been hundreds of quakes in the region. Several researchers have made plots of the activity, posting on twitter, facebook and other social media. Rafael Arce posted a Google Colaboratory notebook with code to plot the earthquake intensities vs time. I've modified the code and made a few plots.
Methods
This Google Colab notebook hosts python code to query the USGS site and plot magnitude vs time.
I'm using a similar technique to Rolando J. Acosta, who posted this figure in his twitter feed. His R code is available on github.
Results
Update
I made a live javascript page that queries the most recent data and plots it. The code for the page is up on github.