Biography
Hola!
My name is Grace M. Rodriguez, I'm a student at the University of Puerto Rico - Rio Piedras Campus and I'm currently transferring to Computer Science. I'm doing a research at the university on Techniques for Anomaly Detection in IPv4 & IPv6 Network Flows with Dr.Humberto Ortiz-Zuazaga. In the semester of 2015, I was able to participate in the Computing Sciences Summer Student Program (CS Summer Student) in the Computational Research Division at Lawrence Berkeley National Laboratory (Berkeley Lab). There, I was able to work with the Operations Technology Group by assisting monitor National Energy Research Scientific Computing Center (NERSC)'s High Performance Systems. I help convert Bash script to Python script for monitoring plugins. I also I worked with Dr. Patricia Ordoñez as her assistant in Google's Computer Science 4 High School in Puerto Rico in the semester of 2015. Apart from cybersecurity, I'm interested in computer graphics, data visualization and animation.
My email is gracemarod@gmail.com, my Github is https://github.com/gracemarod/ and my Linkedln is https://pr.linkedin.com/in/gracemarod.
Project Descrition:
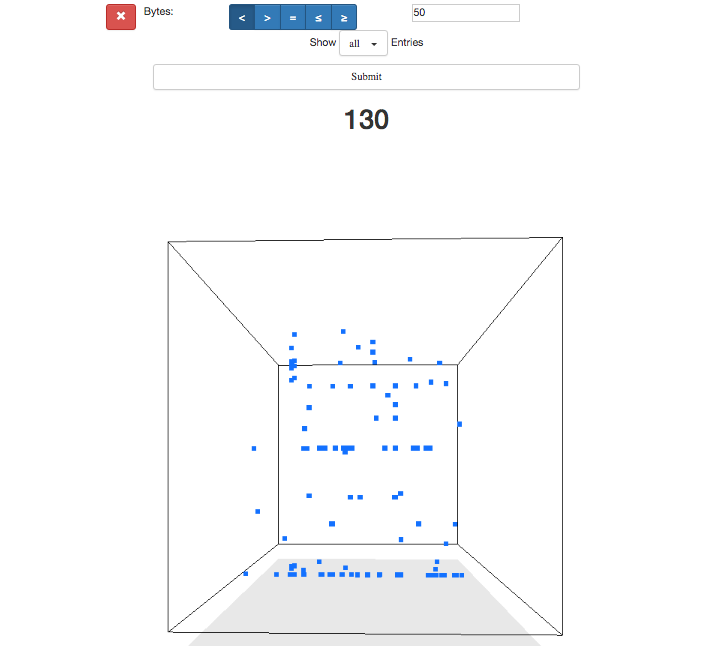
I'm currently researching in ways to analyze anamolies in IPv6 flow data. In the semester of 2015, we used System for Internet-Level Knowledge (SiLK) tools to acquire IPv4 and IPv6 data. With the data acquired, we were able to make a simple Python script that can take the Destination Port, the IP Source Address and IP Destination Address of all the IPv6 flow data given by the text file made by SILK and create x,y and y coordinates from the range of 0 to 1 to make a 3D cube. This help us see the given data a lot better. My work is supported by the scholarship Academics and Training for the Advancement of Cybersecurity Knowledge in Puerto Rico (ATACK-PR)f funded by the National Science Foundation under Grant No. DUE-1438838.
Project Goals
This semester I want to concentrate more in using visualization methods to help us analyze anomalies in IPv6 flows better. So far our goals for this semester are: - Implement the 3D cube for IPv6 address to be real time. - Find and use new methods to visualize flow data.
Week update
Week 1 ( 01/25/16 - 01/30/16):
- Complete application's requirement to submit a poster proposal for the Tapia Conference 2016.
- Fork TOA repository and implement IPv6 flow data in the Cube of Doom (cube.py).
- Went to Julio's and Ian's presentation to see their project on visualazing IP flow data.
Week 2 (01/31/16 - 02/06/16)
- Start reading papers to get more ideas on visualazing IP flow.
- Got a new idea from looking at some projects. After I finish the cube of doom, I want to try and convert the IPv6 adresses to geoIP. With them, using Maxmind database, I want to is display all the ip addresses that connected to the UPR's network wihting a map.
Week 3 (02/07/16 - 02/14/16)
- Donwloaded Maxmind's GeoIP of IPv6 cities and countries.
- Went to Cheo's presentation on Friday where he explained how the Cube of Doom visualizes its flow data and the needed fields from a flow so the cube can display them.
Week 4 (02/15/16 - 02/21/16)
- Julio send me a json with ipv6 flow data.
- After figuring how a json works in Python scrypt for a whi;e, I was able to display the desired data.
- I want to display all the data in a table format, and be able to have the option to choose the fields you want to display.
Week 5 (02/29/16 - 03/04/16)
- Tried to make my json reader script save the data neatly in a file but fail. I don't want to spend too much time on the script so I just print the data in the terminal and save it in file myself. I'll go back and try to fix it when I have more time.
Week 6 (03/03/16 - 03/11/16)
- Really didn't got to do much becouse I was super busy with classes. And when I say "didn't go to fo much" I actually mean I haven't done anything this week.
- Bianca told me I had to do the WyCiS poster for next Monday but I ignored her. I have the IOs bootcamp all weekened plus work so I barely have time to work on it and I want to be able to show the Cube on Doom in the poster. Sorry Bianca.
Week 7 (03/14/16 - 03/18/16)
- Talk to Julio about how to display the 3D cube. He explain how his vizualization work, and he recommened me to ask Cheo about it.
- Hoping there's a 3 day strike so I can catch to research and classes. "Huelga si, entrega no!"
- I think this has become a weekly journal for the whole Megaprobe to see.
Week 8 (03/21/16 - 03/25/16)
- Easter Week. Spent some time practicing Javascript and reading code from TOA to try understand it better.
- Started doing the Research poster for Women in Cybersecurity.
Week 9 (03/28/16 - 04/01/16)
- Finished the poster for Wicys and send it to print.
- Went to the Wicys conference from 30 to April 3rd.
- Presented research poster at Wicys with the title Using Visualization to improve Anomaly Detection in IPv6 Flows.
- I learned new programming techniques and how to find different type of vulnerabilities in web apps. I also met a lot of professionals from both computer science and the cybersecurity fields which gave me advice in graduate studies and job interviews.
Week 10 (04/04/16 - 04/08/16)
- Met with Julio, Ian and Cheo on Wednesday where Cheo explained briefly how the cube works, and how to merge it with Julio's and Ian's API.
Week 11 (04/11/16 - 04/15/16)
- Keep on doing some tutorials with in Javascript.
- Meet with Julio on Tuesday to see how to implement the cube on his API and make it work with real time IP flows from Wolverine.
Week 12 (04/18/16 - 04/15/16)
- Went to the Memory Forensics Workshop both Friday and Saturday.
- Julio was able to implement the cube on his API so it could be seen in his web APP and scp me the code so I could also have access to the cube.
Week 13 (04/18/16 - 04/22/16)
- Finally some results! Me and Julio (mostly Julio) managed to make the cube display static IPv6 data.

Week 14 (04/25/16 - 04/29/16)
- I have been trying to understand the code in ctrpan.js (which is the one that renders the cube and displays the data as particules), but I'm still a bit confused with it.
- I been trying to display the same result as Julio in my directory but alas no results.

Week 15 (04/02/16 - 04/06/16)
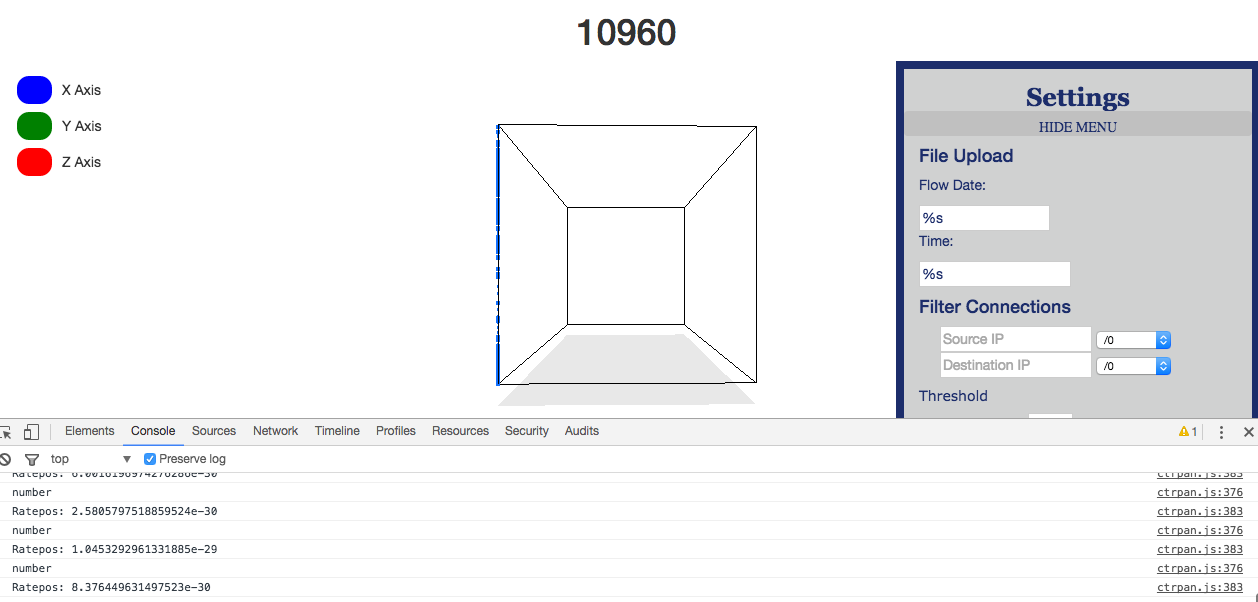
- I scp all of the folders that Julio pass me into my directory in Wolverine to see if I could get some results. DID NOT get the same results, but I did managed to get some particles in the cube. Hoorray! Some data! However all of the particles seem to be in the same axis, so I have to see what the problem is. Humberto says that it might be because the x,y,z are returning all zereos. I have to check that but at least I can see that rate_pos is displaying some type of data.
